Imagine your AI chatbot starts giving slow, weird answers-but no error logs show up. No alarms. No crashes. Just a steady decline in performance that users notice long before you do. This isn’t fiction. It’s happening right now in production LLM systems everywhere. When a GPU-backed large language model (LLM) starts underperforming, it often doesn’t crash. It just gets worse. Slower. Less accurate. More wasteful. And unless you’re watching the right metrics, you won’t know until it’s too late.
What Are Silent Failures in LLM Services?
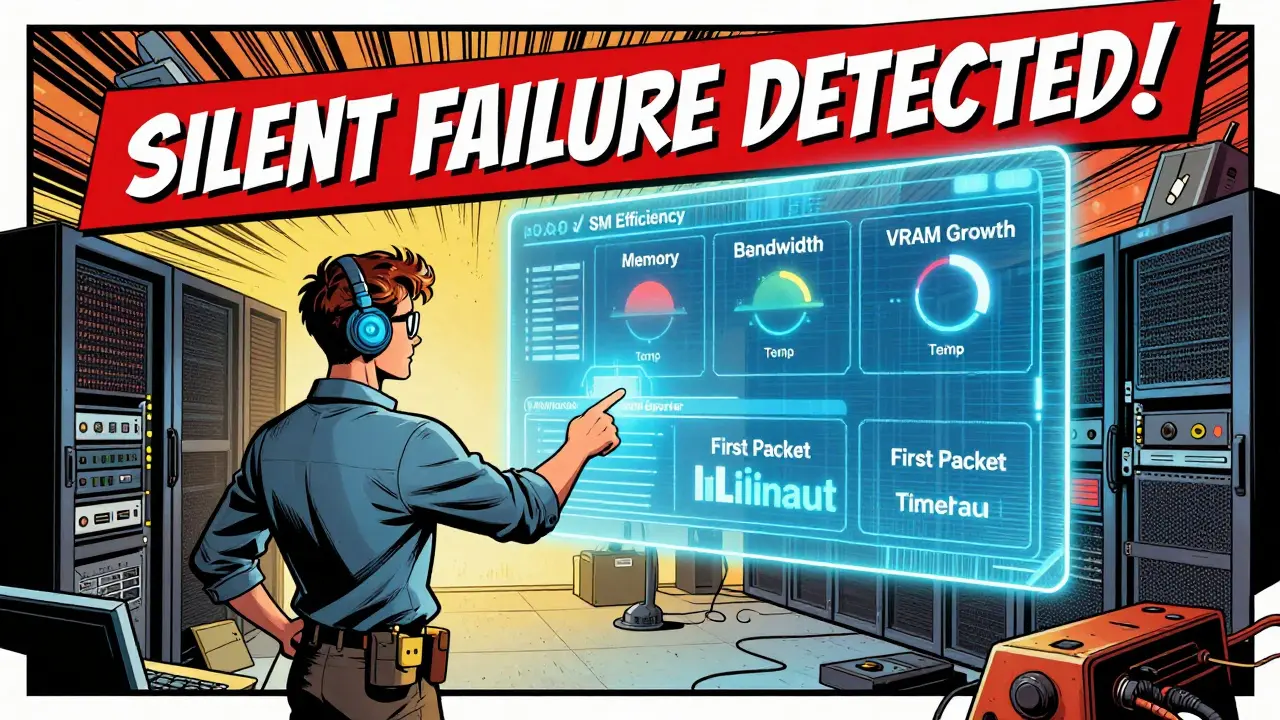
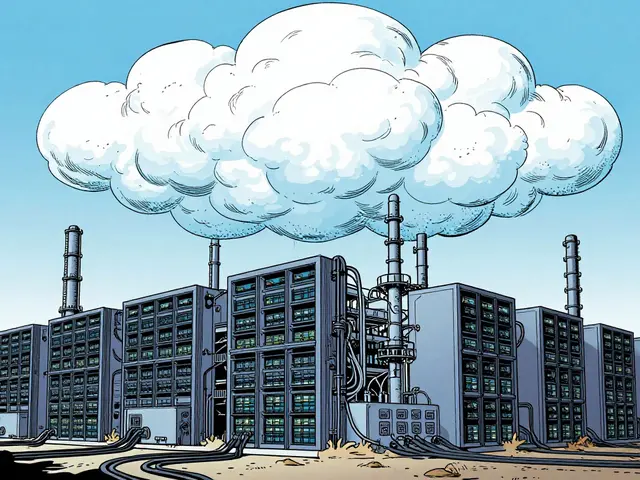
Silent failures are performance problems that don’t trigger traditional alerts. A CPU server might crash when overloaded. A GPU running an LLM? It just keeps going-slower, hotter, and less efficient. The model still responds. Requests still complete. But response times creep up from 600ms to 2,200ms. GPU utilization drops from 75% to 30%. Memory usage slowly climbs. These are signs of trouble, not failure.According to Alibaba Cloud’s 2023 documentation, traditional gateway health checks often miss these issues because they only look for outright crashes or HTTP 500 errors. If the service is still “up,” it stays in rotation-even if it’s delivering garbage results. A 2024 study by Qwak found that 61% of LLM performance degradations went undetected for over two weeks because teams were only monitoring for downtime, not degradation.
These aren’t just technical annoyances. In financial trading systems, a 1.5-second delay in an LLM-powered risk analysis tool can mean lost trades. In customer service bots, slow responses lead to 47% higher abandonment rates, according to Datadog’s 2024 user behavior analysis. Silent failures cost money, trust, and reputation.
Key Metrics to Monitor on GPU-Backed LLMs
You can’t monitor an LLM like a web server. GPUs behave differently. What’s normal for a CPU is dangerous for a GPU. Here’s what actually matters:- SM Efficiency: This measures how well the GPU’s streaming multiprocessors are being used. For LLM inference, you want this above 70%. Below 60%? You’re not using your hardware right-either the model is too small, or you’re under-provisioned.
- Memory Bandwidth Utilization: LLMs move massive amounts of data. If this stays above 85% for more than a few minutes, you’re hitting a bottleneck. This often shows up as high latency even when GPU utilization looks fine.
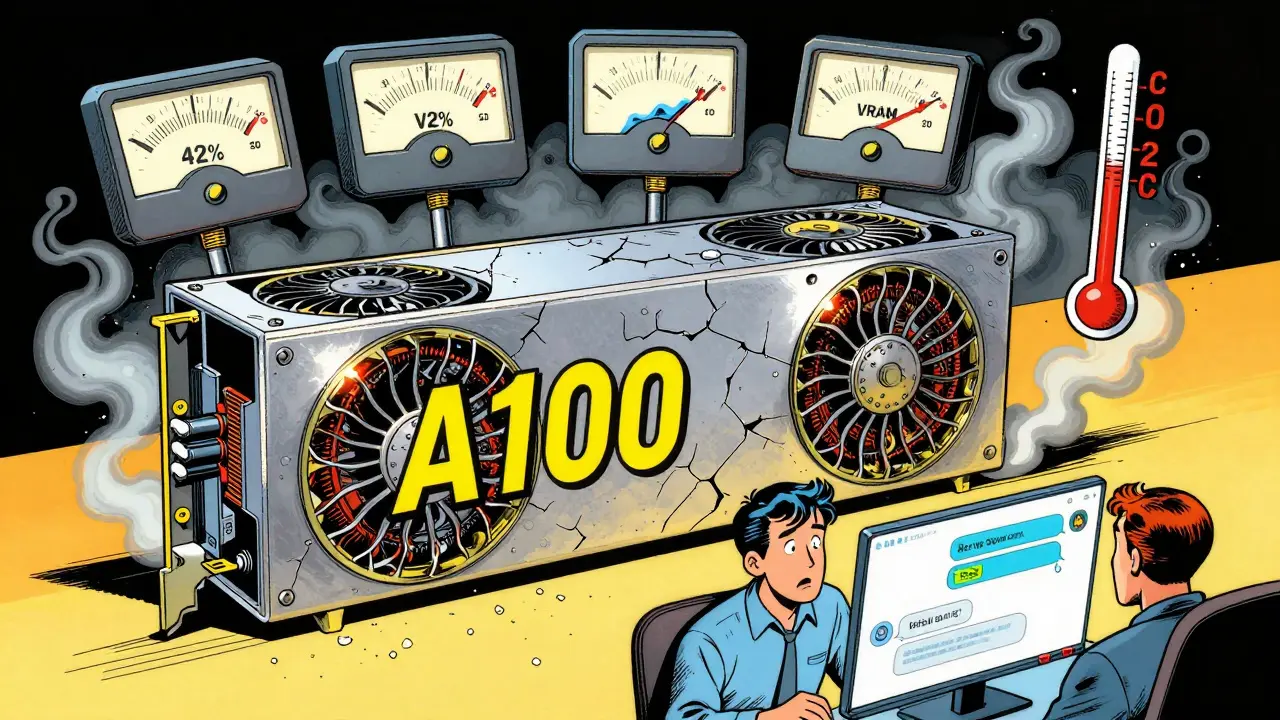
- GPU Temperature: NVIDIA A100s throttle at 85°C. If they hit 90°C for more than 30 seconds, performance drops permanently until cooled. Many teams ignore thermal metrics-until their GPUs die early.
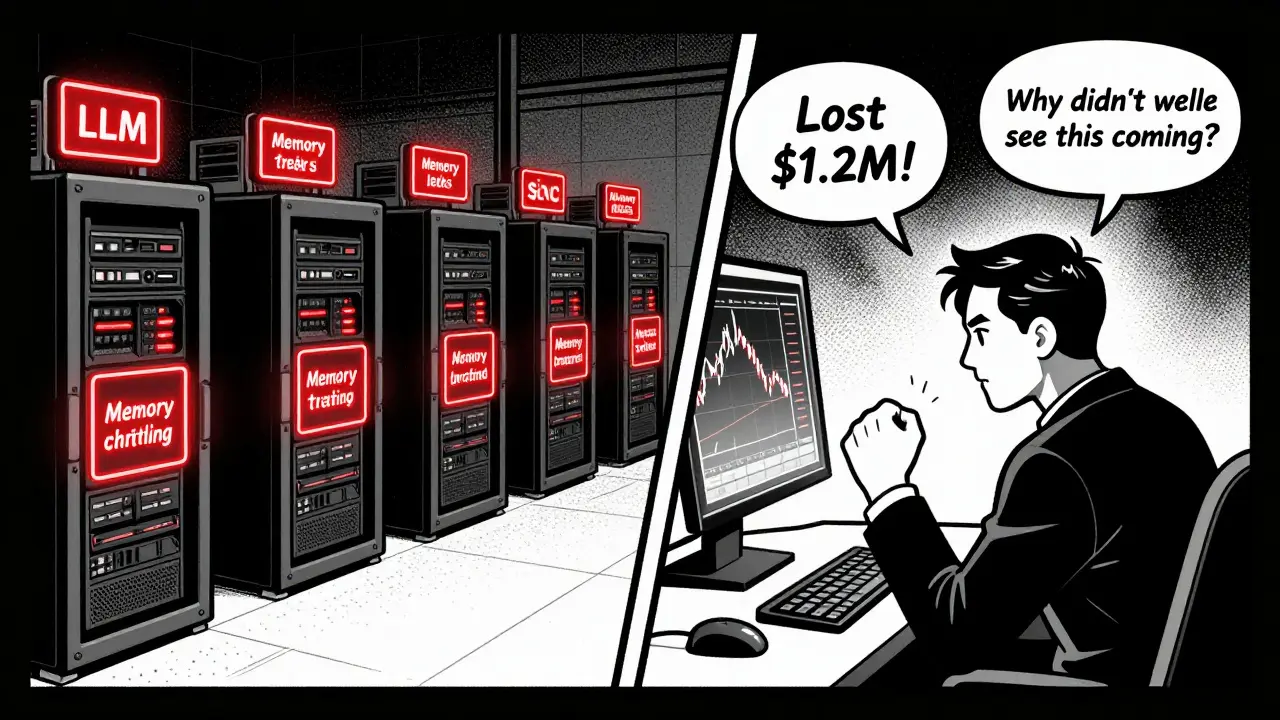
- VRAM Consumption Rate: Memory leaks don’t crash LLMs. They creep. A steady 5% increase per hour in VRAM usage during steady traffic is a red flag. One financial firm lost $1.2M over two weeks because their LLM slowly ate up all available memory-until it stopped responding entirely.
- First Packet Timeout: Alibaba Cloud’s AI Gateway uses 500ms as a hard cutoff. If the first response byte takes longer than that, the request is considered failed. This catches overload before users see full timeouts.
- Request Failure Rate: If more than 50% of requests fail within a 10-second window, the node should be ejected from the pool. This prevents a single bad instance from dragging down the whole service.
These aren’t optional. They’re baseline. Ignoring any one of them leaves you blind to the most common failure modes in production LLMs.
How Health Checks Differ Across Platforms
Not all monitoring tools are built the same. Here’s how the major players stack up:| Platform | Active Checks | Passive Checks | First Packet Timeout | Thermal Throttling Detection | Cost per 1,000 Inferences |
|---|---|---|---|---|---|
| Higress (Alibaba Cloud) | Yes | Yes | 500ms | Yes | $0.08 |
| Datadog | Yes | No | Custom | Yes | $0.25 |
| AWS ALB | Yes | No | 5s | No | $0.05 |
| Envoy Proxy | No | Yes | Not supported | No | $0.00 |
| NVIDIA DCGM + OpenTelemetry | Custom | Custom | Custom | Yes | $0.05-$0.10 |
Higress stands out because it combines active and passive checks. If either fails, the node gets removed. AWS ALB can’t detect thermal throttling or memory leaks. Datadog gives you rich correlations between GPU metrics and business KPIs-but at triple the cost of open-source setups. For most teams, the NVIDIA DCGM exporter paired with Prometheus and Grafana offers the best balance: full control, deep GPU visibility, and low cost.
Minimum Viable Observability (MVO) for LLMs
You don’t need to monitor 200 metrics. Start small. Here’s what a DevOps engineer in Asheville (or anywhere) should do in under a day:- Deploy the NVIDIA DCGM exporter as a daemonset in Kubernetes. This scrapes GPU metrics directly from the hardware.
- Use the Prometheus receiver in the OpenTelemetry Collector to pull in DCGM data.
- Set up alerts for just five metrics: SM efficiency below 65%, memory bandwidth above 85%, temperature above 85°C, VRAM growth over 5% per hour, and first packet timeout above 500ms.
- Build a simple Grafana dashboard showing these five metrics over time. No fancy AI. Just raw numbers.
- Test it. Simulate a memory leak by running a script that allocates VRAM. Does your alert fire? Good.
This is the MVO setup recommended by TechStrong.ai. It takes 8-12 hours. It catches 80% of silent failures. It’s cheap. And it’s better than what 70% of companies are doing right now.
Why Generic Monitoring Fails for LLMs
Most teams try to use their existing APM tools-Datadog for web apps, New Relic for APIs. But LLMs aren’t APIs. They’re stateful, memory-hungry, GPU-bound workloads with unique failure modes.Dr. Jane Chen from Alibaba Cloud says it plainly: “Traditional gateway detection mechanisms are often delayed for LLM services.” Why? Because they’re built for request-response cycles, not tensor flows. A CPU server might slow down under load. A GPU will keep pushing data-but start throttling, leaking memory, or underutilizing cores.
Professor Michael Black from MIT put it bluntly in a 2024 IEEE Spectrum interview: “In-band metrics can’t detect failing fans or power limits. You need out-of-band monitoring.” That means reading hardware counters directly-not just HTTP status codes.
And then there’s alert fatigue. Dr. Sarah Johnson from Stanford warns against monitoring everything. “Over-monitoring leads to noise,” she says. “You’ll get 50 alerts a day, and none of them matter.” The goal isn’t to collect data-it’s to detect what breaks your service.
What’s Next: Predictive Health Checks
The next frontier isn’t just monitoring-it’s predicting. NVIDIA’s DCGM 3.3, released in November 2024, now tracks attention mechanism efficiency and KV cache utilization. These were invisible before. Now you can see if your model is struggling with long prompts.MIT researchers are training lightweight models to predict GPU failures 15-30 minutes in advance-with 89.7% accuracy. They don’t wait for temperature spikes or memory leaks. They detect subtle shifts in power patterns and clock behavior that precede hardware stress.
Alibaba Cloud is rolling out dynamic baselines that adjust as your model learns. If your LLM gets better at answering customer questions, its ideal GPU utilization changes. Static thresholds become useless. Dynamic baselines adapt.
By 2027, IDC predicts 89% of Global 2000 companies will use comprehensive GPU health monitoring. The ones that wait will be the ones getting blindsided by silent failures.
Final Checklist: Are You Protected?
Ask yourself these questions:- Do I monitor SM efficiency, not just GPU utilization?
- Do I alert on VRAM growth over time-not just peak usage?
- Do I use first packet timeout to catch overload before users notice?
- Do I check temperature at 85°C+, not just 95°C?
- Do I use DCGM exporter, or am I relying on cloud provider defaults?
If you answered ‘no’ to any of these, you’re running blind. Start with the MVO setup. Get the metrics. Set the alerts. Test it. Then expand. Silent failures don’t announce themselves. You have to catch them before they cost you.
What’s the difference between GPU utilization and SM efficiency in LLMs?
GPU utilization measures how much of the GPU’s total capacity is being used. SM efficiency measures how effectively the streaming multiprocessors are processing instructions. You can have 90% utilization but only 40% SM efficiency-meaning the GPU is busy but wasting cycles. For LLMs, SM efficiency above 70% is the real indicator of healthy performance.
Can I use Prometheus alone for GPU health checks?
No. Prometheus scrapes metrics but doesn’t collect them from the GPU hardware. You need the NVIDIA DCGM exporter to pull GPU-specific data like thermal throttling, memory bandwidth, and SM clock rates. Prometheus just stores and queries that data once it’s exposed.
Why do LLMs need lower first packet timeouts than regular APIs?
LLMs generate responses token-by-token. The first token can take 1-2 seconds on a loaded system. If you set your timeout to 5 seconds like a web API, you’ll wait too long to detect overload. A 500ms timeout forces early detection-so you can remove a slow node before it backs up the whole queue.
Is $0.25 per 1,000 inferences too expensive for Datadog?
It depends. If you’re doing 10 million inferences a day, that’s $2,500/month. For most enterprises, that’s justified if you’re avoiding $1M+ losses from silent failures. But if you’re a startup or mid-sized team, you can get 90% of the value using open-source tools like DCGM + Prometheus for under $100/month in cloud costs.
Do I need to monitor every GPU in my cluster?
Yes-if they’re running LLM workloads. Even one underperforming GPU can skew results for the whole service. Monitoring only the “main” node misses the 30% of failures that come from marginal hardware. Use daemonsets to collect from every node automatically.


6 Comments
Addison Smart
Man, this post hit me right in the feels. I’ve been running LLMs in production for over a year now and I swear, the silent failures are worse than outright crashes. You think everything’s fine because the API’s still responding, but then you check the logs and realize your users are getting answers that make no sense-like, ‘the capital of France is banana’ level of nonsense. And nobody notices until someone complains on Twitter. SM efficiency is the real MVP here. I used to just watch GPU utilization and thought I was golden. Then I started tracking SM efficiency and found out half my nodes were running at 85% GPU usage but only 38% SM efficiency. Turns out, my batching was garbage. Fixed it, cut latency by 40%, and saved $2k/month in wasted compute. Don’t sleep on the little metrics. They’re the ones that’ll save your ass.
Also, thermal throttling? Yeah, I ignored that too until one of our A100s died after 14 months. Warranty didn’t cover it because ‘it was abused.’ Turns out, our cooling fans were clogged with dust. Simple fix. But we didn’t have alerts. Now we do. Every node. Every hour. No excuses.
And yes, Prometheus alone won’t cut it. You need DCGM. No debate. It’s not rocket science. Just install the exporter, point Prometheus at it, and boom-you’ve got visibility into what actually matters. Stop using cloud defaults. They’re designed for marketing slides, not real-world chaos.
Lissa Veldhuis
Ugh I’m so sick of people acting like this is some groundbreaking insight. Like oh no the GPU got hot? What did you expect? You’re running AI on silicon that’s basically a toaster with ambitions. I’ve seen teams spend six months building dashboards and still miss the fact that their model was trained on garbage data. You don’t need fancy metrics-you need better data. And better engineers. Stop chasing metrics and start fixing your pipeline. Also why is everyone using NVIDIA? AMD has better memory bandwidth and doesn’t throttle at 85°C. But nooo, we gotta stick to the brand.
And don’t even get me started on that $0.25/inference thing. Datadog’s charging more than the actual GPU costs. You’re not a startup-you’re a finance bro with a GPU farm and a credit card. Get real.
Also first packet timeout at 500ms? That’s insane. My phone takes longer than that to load a webpage. You’re gonna piss off your users with false positives. Just let it breathe. Not every slow response is a failure. Sometimes it’s just… thinking.
PS: I’ve been doing this since 2021. I’m not impressed.
Michael Jones
There’s something beautiful about how hardware reveals truth. No fluff. No corporate BS. Just volts, amps, and heat. You can lie to yourself about your model’s performance. You can lie to your boss. You can lie to your users. But the GPU? It doesn’t care. It just sits there, clocking slower, getting hotter, leaking memory like a broken faucet. And it doesn’t scream. It just… fades. That’s the real horror story here. Not the cost. Not the latency. The quiet erosion of trust. People don’t notice when the bot gets dumber. They just stop asking questions. And that’s when you lose them for good.
I used to think monitoring was about control. Now I think it’s about humility. You don’t own the GPU. You borrow it. And if you don’t listen to what it’s telling you, it’ll walk away. One day, your instance just stops responding. No logs. No crash. Just… gone. And you realize you never really knew it at all.
Start small. Five metrics. One dashboard. One alert. Let the silence speak. Then listen.
- Michael, who still remembers the first time his LLM said ‘I don’t know’ instead of making something up.
allison berroteran
This was so helpful. I’ve been working on a small LLM project for a nonprofit and I was totally overwhelmed by all the metrics. I thought I needed to track everything-memory, bandwidth, temperature, tokens per second, attention weights, the whole kitchen sink. But your MVO checklist? That’s exactly what I needed. I spent two hours last night setting up DCGM + Prometheus and I already caught a memory leak I didn’t even know existed. My VRAM was creeping up 7% an hour. I thought it was normal. Turns out, it was a bug in my tokenizer. Fixed it in 10 minutes. No downtime. No panic. Just a quiet little alert that saved me from a nightmare.
I also love how you emphasized testing the alert. I’ve never done that before. I just assumed if the metric was there, the alert would work. Big mistake. I simulated a leak and watched the graph spike. Then I got the Slack notification. It felt so good. Like I was finally in control.
Thank you for writing this. It didn’t feel like a technical manual. It felt like a friend showing up with coffee and a flashlight in the dark. That’s rare. I’m sharing this with my whole team tomorrow.
P.S. If anyone’s wondering about the cost-yes, open source is the way. I’m running this on a single $100/mo AWS instance. No Datadog. No fancy tools. Just clean, simple, honest monitoring. It works.
Gabby Love
Just wanted to say thank you for the clear breakdown. I’m a junior DevOps engineer and this was the first time I actually understood what SM efficiency meant. I was confused between utilization and efficiency for weeks. Now I get it-utilization is how busy the GPU is, efficiency is how well it’s using that time. Makes so much sense. I implemented the five metrics last week and already caught a thermal issue on one of our nodes. The temperature hit 87°C for 45 seconds and the alert fired. We shut it down, cleaned the fan, and it’s back to 78°C. No damage. No downtime. Just good old-fashioned vigilance.
Also, the DCGM exporter setup was way easier than I thought. Just a Helm chart and a few lines in the config. No need to overcomplicate it. Sometimes simple wins. Really appreciate you laying it out like this.
David Smith
Wow. Just… wow. You spent all this time writing about GPU metrics and didn’t even mention that the real problem is that we’re running LLMs at all. Who decided that a machine should answer customer service questions? Who said a chatbot should handle financial risk analysis? We’re outsourcing human judgment to silicon and then pretending we can monitor it like a car engine. It’s not a machine failing-it’s a system of delusion failing. We built a house of cards and now we’re installing smoke detectors on each card. It’s not a fix. It’s a distraction.
Also, why are we still using NVIDIA? Why not build our own chips? Why not use quantum? Why not just… stop? This whole thing is a Ponzi scheme wrapped in a tech blog. I’m out.
- David, who used to believe in AI. Now he just believes in silence.